> For the complete documentation index, see [llms.txt](https://jonghan.gitbook.io/ctf-writeups/llms.txt). Markdown versions of documentation pages are available by appending `.md` to page URLs; this page is available as [Markdown](https://jonghan.gitbook.io/ctf-writeups/2022/standcon-2022/reverse/new-math.md).
# New Math!
## Description
> Hooray for new math! New whoo hoo math!
> Wrap the flag in STANDCON22{}
{% file src="/files/tLt1XhxzjPyliPkkbsxR" %}
### Overview
Reverse math, well not really.
Pretty unique challenge. I would say this challenge wasn't fun for me, but it was pretty satisfying to see the final art piece.
### TL;DR
* Find out file is a program written with TI Connect CE software
* Open file in TI Connect CE and reverse engineer code
* Notice flag is drawn using line and circle graphs
* Draw flag with a graphing tool or whatever suits you
* Achieve flag
## Solution
### Analysis
Checking the file of [NewMath](https://github.com/YeoJongHan/CTF_WriteUps/blob/main/challenge_files/STANDCON_2022/Reverse/New%20Math!/challenge/NewMath), it looks to be a program for a `TI-83+ Graphing Calculator`, whatever that is.

Doing quite a bit of searching online, I found that the website contains the software that we need in order to check the contents of [NewMath](https://github.com/YeoJongHan/CTF_WriteUps/blob/main/challenge_files/STANDCON_2022/Reverse/New%20Math!/challenge/NewMath). I know this because the calculator program needs to be written by a software and is the official provider of the TI calculators.
Which software to install? I didn't know either but looking around the [NewMath](https://github.com/YeoJongHan/CTF_WriteUps/blob/main/challenge_files/STANDCON_2022/Reverse/New%20Math!/challenge/NewMath) file, we can see the software name in plaintext in the header.

So I searched online for "education.ti ti connect ce" and found the software to download at .
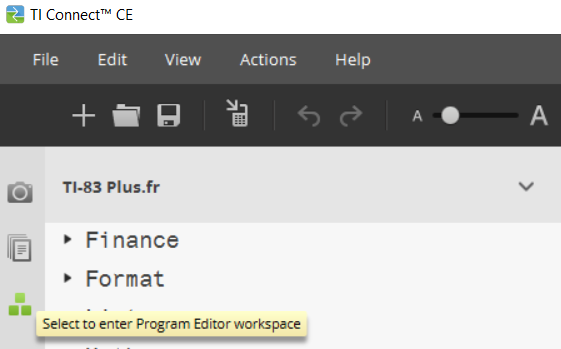
Open the software and head to the "Program Editor" as that is the only tab that can import files.
I noticed that the software is looking for files with the `.8xp` extension, so rename [NewMath](https://github.com/YeoJongHan/CTF_WriteUps/blob/main/challenge_files/STANDCON_2022/Reverse/New%20Math!/challenge/NewMath) to `NewMath.8xp` and open it with the software. We can finally see what the program actually does.
### RE the program
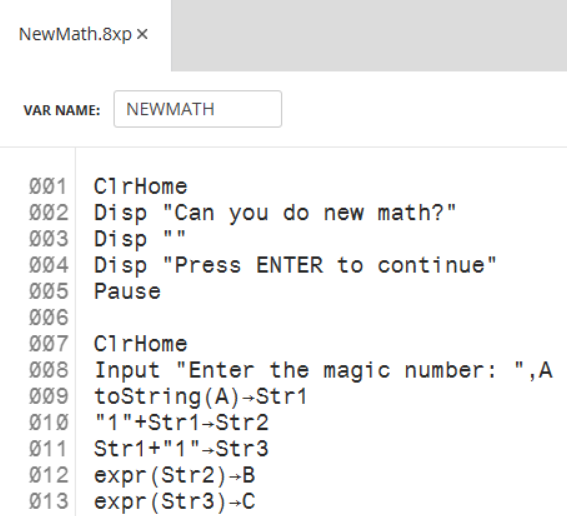
`NewMath.8xp`
```
ClrHome
Disp "Can you do new math?"
Disp ""
Disp "Press ENTER to continue"
Pause
ClrHome
Input "Enter the magic number: ",A
toString(A)→Str1
"1"+Str1→Str2
Str1+"1"→Str3
expr(Str2)→B
expr(Str3)→C
If 3B=C and length(Str1)=5
Then
Disp "Correct!"
ClrHome
Disp "Enter the second"
Input "magic number: ",D
If abs(fMax(-2X^2+25X+4,X,0,10)-D)<0.01
Then
Disp "You got full marks!"
Disp "YOU WIN"
ClrDraw
ZStandard
2→Xmin
34→Xmax
4→Ymin
4→Ymax
Line(8,0,10,0)
Line(100/D,1,100/D,2)
Line(100/D,1,(D+50)/3.125,1)
Line((A-27232)^(1/3),0,(D*6)-10.5,1000*0*20)
Line((A-15209)/1024,1,52-23,100-99)
Line((A-D-42822.75),0,A-D*44-42554,2)
Line(30,0,30,2)
Line(2*D+8.5,0,2*D+8.5+2,0)
Line((A-41477)/60,0,√(576),2)
Line(23.5,1,24.5,1)
Line(150/D,60-58,√(A-42232),0)
Line(62.5/D,2,12,A/21428.5)
Line(0,0,0,12.5/D)
Line(B/(71424.5+4),0,C*0,√(39.0625)/3.125)
Line(2,0,(C-6585)/210993,(B-6353)/68252)
Circle(D/1.5625,3-2,D-5.25)
Line(D-0.25,2,D+1.75,10/5)
Line(43.75/D,0,C-428564,4-2)
Line(187.5/D,0,(A-28297)/455,0)
Line(√(D*144),98-96,(A-24809)/564,100-98)
Line((A-5003)/2103,9-8,(B-132615)/569,0)
Line((A-32139)/653,0,18,0)
Line((A-19031)/1254,48-46,D+14.75,2)
Line(√(A-42457),0,√(A-42457),2)
Line(A-42846,0,A-42846,7-5)
Line(10,1,A-42846,0)
Line(C/32967,0,81.25/D,4-2)
Line(B/10989,0,B-142842,0)
Line(15,0,15,2)
Line(16,2,18,2)
Else
Disp "You tried, but you still"
Disp "can't do Math :("
Disp "YOU LOSE"
End
Else
Disp "You failed your math test :("
Disp "YOU LOSE"
End
```
Now, I don't own a Graphing Calculator and buying one isn't going to be an investment. Not sure if the program would run on the calculator either.
I tried to search for a TI-83+ Graphing Calculator emulator too, but I think it would be quickest to find the flag by understanding what the code does.
I spent quite some time finding information on the syntax of the code that this program uses. Seems like it has very little documentation or I'm just bad at searching, but I've found a website that is quite useful in telling me what I need to know .
The long lines of `Line()` function with a single `Circle()` function is to draw a bunch of graphs.
`Line()` accepts 4 arguments. x1y1 is the start of the line, x2y2 is end of the line.

`Circle()` accepts 3 arguments. xy is the coordinates of the middle of the circle, radius is the radius.

At this point, I think it is fair to assume that the flag would be drawn out using graphs.
Now, the drawing of the graphs uses 4 variables `A`, `B`, `C`, and `D`. We can see that they are defined in the first few lines of code.
```
Input "Enter the magic number: ",A
toString(A)→Str1
"1"+Str1→Str2
Str1+"1"→Str3
expr(Str2)→B
expr(Str3)→C
If 3B=C and length(Str1)=5
Then
Disp "Correct!"
ClrHome
Disp "Enter the second"
Input "magic number: ",D
If abs(fMax(-2X^2+25X+4,X,0,10)-D)<0.01
Then
Disp "You got full marks!"
Disp "YOU WIN"
```
The first few lines are pretty self-explanatory. It asks for user input and stores it in the variable A, then converts it to a string and stores it in `Str1`.
```
Input "Enter the magic number: ",A
toString(A)→Str1
```
A "1" is then attached to the **front** of the string and stored in `Str2`.
A "1" is also attached to the **end** of the user input string and stored in `Str3`.
No idea what the function `expr()` does but I guess that it just converts the string into numbers.
```
"1"+Str1→Str2
Str1+"1"→Str3
expr(Str2)→B
expr(Str3)→C
```
It then checks if the following is true. As like in algebra, 3B would be just 3\*B.
```
If 3B=C and length(Str1)=5
```
I created a quick Python script to iterate from `00000` to `99999` to find which number satisfies this check and found the number `42857`.
```python
#!/usr/bin/env python3
for i in range(100000):
str1 = (5-len(str(i)))*'0'+str(i)
B = int("1"+str1)
C = int(str1+"1")
if 3*B == C:
print(str1)
break
# Found: 42857
```
Now we have:
* A = 42857
* B = 142857
* C = 428571
To find `D`, we need to solve for this check:
```
Input "magic number: ",D
If abs(fMax(-2X^2+25X+4,X,0,10)-D)<0.01
```
This essentially means that we need `fMax(-2X^2+25X+4,X,0,10)-D` to be equal to 0, or around there (because of the *abs(...)*).
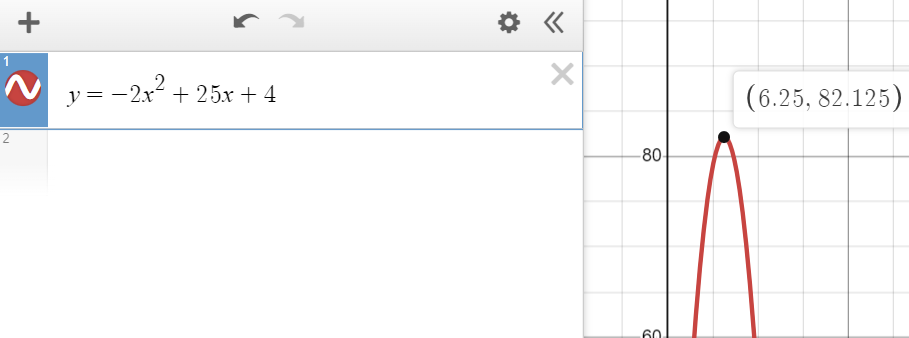
So if we find the value of `fMax(-2X^2+25X+4,X,0,10)`, we can enter it as our `D` value and get 0.
I had to find out what does the `fMax` function do. It brought me back to [education.ti](https://education.ti.com/en/customer-support/knowledge-base/ti-83-84-plus-family/product-usage/34615)

I managed to solve this using [Desmos](https://www.desmos.com/), my Secondary School hero.
### Desmos To The Rescue!
Entering the quadratic equation into demos, we can see that the maximum point of the graph where 0\
Now the painful part. I manually entered every single `Line` and `Circle` graph into [Desmos](https://www.desmos.com/) as I think it would take me longer to try and figure out how to draw such graphs using a programming language like Python (I actually didn't search how to code it).
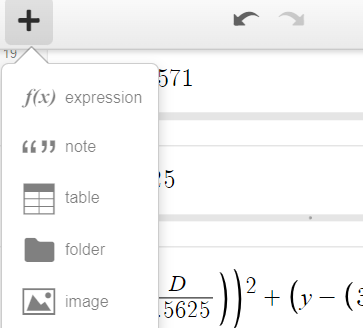
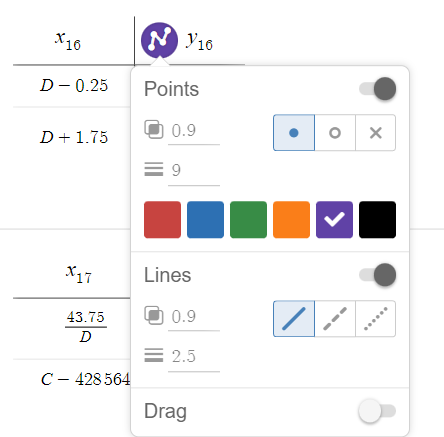
In [Desmos](https://www.desmos.com/), you can create a line graph from one point to another point using a table like so.

> Remember to define the `A`, `B`, `C`, and `D` variables.
Insert table:
Enter numbers x1y1 and x2y2, and hold left click on the colored circle beside the `y` to add lines between the points.
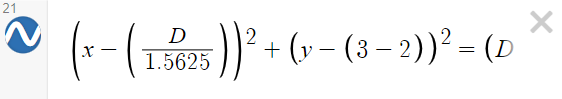
To draw a circle, just enter a circle equation.
This piece of art took me around 20 minutes to replicate:

Flag: `STANDCON22{NOT_JUST_A_+C}`